As a Research Software Engineer, I work with Professor Reed Maxwell’s group, helping scientists better understand how water moves through the environment. Our lab studies computational hydrology, which means we use mathematical models to simulate how groundwater and surface water flow across landscapes. These simulations help researchers explore questions related to current groundwater availability, future scenario predictions, and long‑term water sustainability.
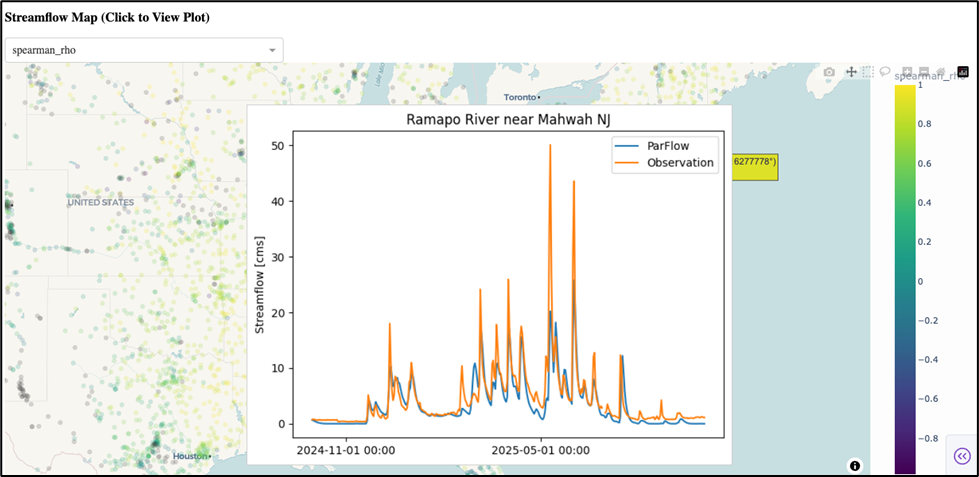
Recently our team, together with collaborators at the University of Arizona, has been building a continental‑scale model of water movement across the entire United States using the integrated groundwater model ParFlow. A model this large produces quite a bit of data, and one of my goals was to make it easier for the research team to explore and interpret the results. To help with this, I built a small interactive dashboard using Dash, a Python framework that lets you create web apps with interactive plots and maps. The dashboard lets us directly compare model results with real‑world observations: for example, streamflow measurements from monitoring stations. This helps researchers quickly see where the model is performing well and where it may need adjustment.
While there were some quirks to get the initial dashboard set up, the step that proved to be more challenging was in how to share it with all of the collaborators.
Our group works on a high‑performance computing (HPC) cluster, because our simulations are too large to run on a laptop. But HPC environments aren’t naturally designed for running web applications, especially not ones that multiple people may want to launch on demand.
We needed a solution that would:
- Let anyone on the team launch the dashboard without installing software
- Scale up if we wanted to start visualizing the project’s larger datasets
- Be friendly to both programmers and non‑programmers
That’s where Open OnDemand came in.
Open OnDemand (OOD) is a web platform that sits on top of an HPC cluster and gives users the ability to run jobs, move files, and launch applications, all from a browser. Instead of everyone needing to memorize Unix commands or write job scripts, they can launch the dashboard in just a couple of clicks.
What I didn’t know at first was that OOD supports two distinct ways of deploying custom applications. Choosing between them turned out to be a key technical decision.
Open OnDemand supports:
1. Passenger Applications
These behave like traditional web apps.
- They run on the cluster’s login or “head” node.
- They’re ideal for small, lightweight applications with modest computing needs.
- They automatically stay online, which is convenient.
For our dashboard, this approach wasn’t ideal. Because our visualizations can involve large model outputs, running everything on the head node could slow things down or interfere with other users.
2. Interactive Applications
These work differently:
- Each time a user launches the app, OOD submits a job to the cluster
- That job reserves compute resources on one of the worker nodes
- OOD then connects the user’s browser to that job so the app runs inside the HPC environment
This design has important advantages:
- The dashboard can use as much memory or computing power as the user requests
- Each user gets their own isolated instance
- It keeps our options flexible in case we want to add more computational complexity to the dashboard in the future
For our use case, we decided the Interactive App approach gave us the most flexibility for future development.
In the final setup, running the dashboard looks like this:
- A collaborator logs into our cluster’s Open OnDemand page
- They click on the dashboard’s icon under “Interactive Apps”
- They choose how many hours their session will be
- They click “Launch”
- Within a minute or two, a unique dashboard session opens right in their browser
This means hydrologists who may not write code every day can still explore large datasets and investigate model behavior, without ever touching the command line.
Setting this up taught me a lot about how Open OnDemand handles custom applications. To help others who might be trying something similar, I put together a small GitHub repository with several “Hello World” examples to show how both Passenger and Interactive apps can be developed, both with and without Dash.
You can find it here: https://github.com/amy-defnet/hello-world-ood
Making scientific tools accessible is just as important as building them. By turning complex datasets into an interactive dashboard that anyone on the team can launch with a few clicks, we’ve made it easier for researchers to analyze results, spot issues, and ask new scientific questions. I’m excited to continue improving this tool and exploring new ways to help scientists use computational models more effectively.